Beyond Closed-Won: A Deep Dive into Lead Monsta's Sales Performance & Pipeline Reports
Your Lead Monsta marketing campaigns are successfully generating leads for your Australian business, and these potential customers are now flowing into your Opportunities (Sales Pipelines). This is a fantastic sign of a healthy top-of-funnel. But the crucial next question is: how effectively are these potential deals being managed, nurtured, and converted into actual, tangible revenue?
Simply tracking the final number of "Closed-Won" deals provides a very limited and often misleading picture of your sales health. To truly understand your sales engine, you need to look deeper. You need clear insights into the entire sales process to identify its strengths, its weaknesses, and, most importantly, its opportunities for strategic optimisation. This is where you leverage opportunity analytics.
This is precisely the role of Lead Monsta's sales-specific reporting features. They serve as your window into the health, velocity, and effectiveness of your sales pipeline and your sales team's performance. They provide the GHL pipeline analytics Australia based SMEs need to move beyond guesswork.
The goal of this article is to guide Australian SMEs on how to leverage Lead Monsta's powerful sales reports. We will explore how to analyse pipeline velocity, track conversion rates between stages, understand deal values, and monitor sales representative activity. This will enable you to formulate data-driven strategies designed to improve your sales outcomes and drive sustainable growth.
Table of Contents:
Why Deep Sales Performance Reporting is Vital for Aussie SMEs
Accessing Sales & Pipeline Reports in Lead Monsta
Deconstructing Your Lead Monsta Sales Pipeline Reports: Key Metrics & KPIs
Funnel Conversion Rates (Stage-to-Stage)
Average Deal Value (for Won Deals)
Number of New Opportunities Created
Analysing Sales Team Performance (If Applicable - Agent Reporting in Lead Monsta)
Opportunities Owned/Worked per Rep:
Using Sales Reports to Make Strategic Decisions for Your Aussie Business
Optimising Your Sales Process:
Refining Sales Training & Coaching:
Improving Lead Quality (Providing Feedback to Marketing):
Best Practices for Sales Performance Reporting in Lead Monsta
Why Deep Sales Performance Reporting is Vital for Aussie SMEs
To operate a truly intelligent sales function, you must move beyond just looking at the final revenue numbers. Comprehensive sales performance reporting is vital for several strategic reasons:
Understand True Sales Health: Detailed reports allow you to see the efficiency and effectiveness of your entire sales process. Are deals moving smoothly, or are they getting stuck? Is your pipeline healthy and full, or is it looking sparse for the upcoming quarter? These insights provide a much more accurate diagnosis of your sales health than revenue figures alone.
Identify Bottlenecks & Stalled Deals: Granular pipeline reports make it easy to pinpoint specific stages where deals are consistently slowing down or dropping off. This intelligence allows you to investigate the root cause and implement targeted solutions, whether it's improving your follow-up process or refining your proposal strategy.
Achieve Accurate Sales Forecasting: Reliable sales forecasting is built on historical data. By understanding your average conversion rates between stages, the average value of your deals, and your typical sales cycle length, you can predict future revenue with much greater accuracy, enabling smarter financial planning and resource allocation.
Optimise Your Sales Strategies: Data provides the answers. By analysing your reports, you can understand which sales approaches, lead sources, or even product/service offerings lead to higher close rates or faster sales cycles. This allows you to double down on what works and refine what does not.
Improve Sales Team Performance: For businesses with sales teams, data is the key to effective management and coaching. Objective sales performance metrics SME managers can use allow you to identify top performers, understand their successful habits, and provide targeted, constructive coaching to team members who may be struggling in specific areas. It also allows you to set realistic, data-backed goals.
Maximise ROI from Marketing-Generated Leads: Your marketing team works hard to generate leads. Sales performance reports show you how effectively those leads are being pursued and converted. Low conversion rates despite high sales activity might indicate an issue with lead quality, providing crucial feedback to the marketing team. For any business owner, perhaps reviewing the week's sales efforts on a Saturday from their home in Elanora, this data is crucial for planning how to get better results in the week ahead.
Accessing Sales & Pipeline Reports in Lead Monsta
Lead Monsta centralises your sales analytics, making it accessible for regular review.
Key Reporting Dashboards and Views
You can typically access your sales data by navigating to the main "Reporting" section in your Lead Monsta dashboard. Within this section, look for specific reports such as:
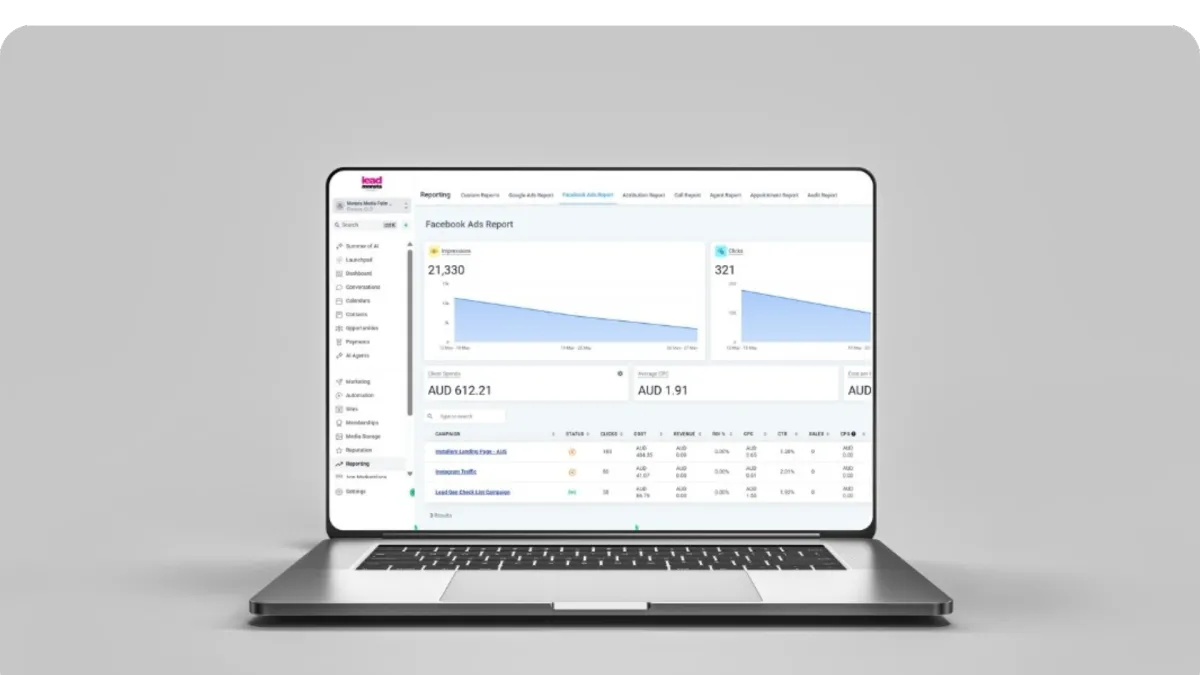
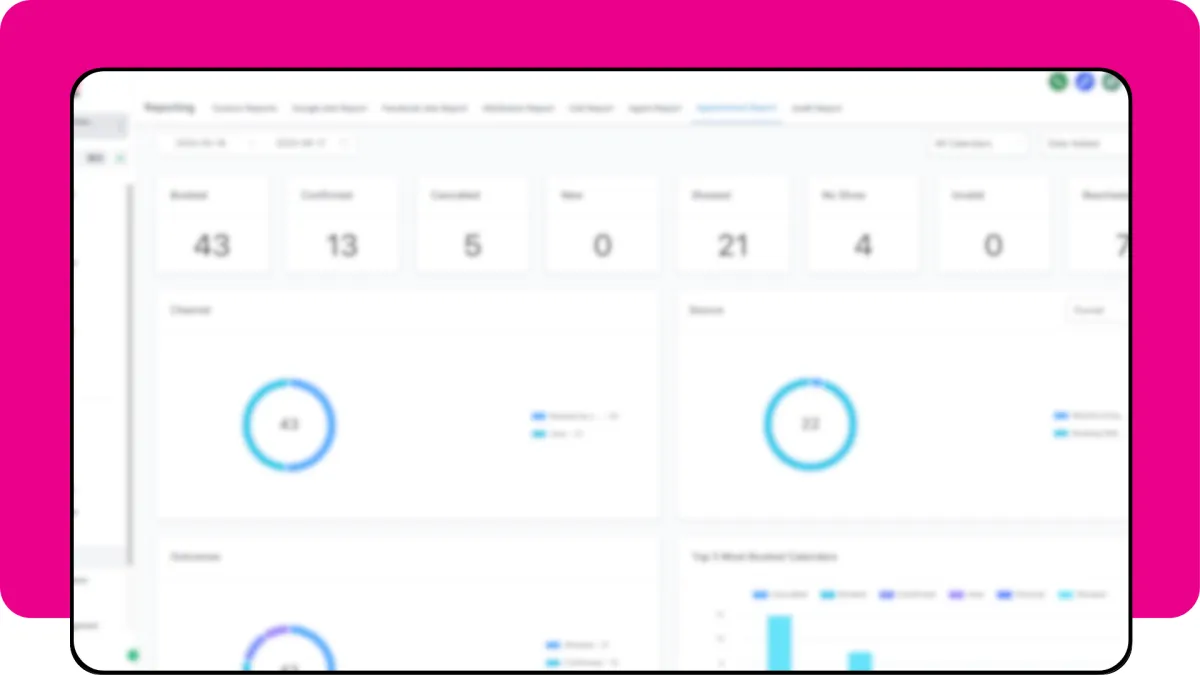
Sales Report: This is often a summary dashboard that provides a high-level overview of key metrics like conversion rates, pipeline value, and won deals over a selected period.
Pipeline-Specific Views: Don't forget the analytics available directly within the "Opportunities" tab itself. You can often view powerful visualisations like funnel charts that break down conversion rates by stage for a specific pipeline.
Agent Reporting / User Performance: For team-based insights, look for reports specifically labelled for agent or user performance. This is where you will find sales team reporting GHL functionality.
Filtering for Specific, Actionable Insights
To get the most out of your reports, you must use filters to drill down into specifics. You can typically filter your sales data by:
Date Ranges: Analyse performance for last week, last month, last quarter, or a custom date range.
Specific Pipelines: If you have multiple sales pipelines (e.g., for different services), you can analyse the performance of each one individually.
Sales Representative (User): Filter the reports to see the performance metrics for a specific team member.
Deal Status: Focus your analysis on "Won," "Lost," or "Open" deals.
Deconstructing Your Lead Monsta Sales Pipeline Reports: Key Metrics & KPIs
Understanding the following metrics is fundamental to interpreting your sales performance correctly and being able to effectively track sales conversions.
Funnel Conversion Rates (Stage-to-Stage)
What it is: This metric shows the percentage of opportunities that successfully advance from one stage of your customised sales pipeline to the next. For example, the conversion rate from "Discovery Call Held" to "Proposal Sent."
Why it matters: This is one of the most powerful diagnostic tools you have. It immediately highlights where in your sales process leads are dropping off or getting stuck. A low conversion rate between two specific stages is a major red flag that that part of your process needs investigation and optimisation.
Lead Monsta View: This is often visualised as a funnel chart within the Opportunities or Reporting section, clearly showing the number of deals and the conversion percentage at each stage.
Overall Win Rate / Close Rate
What it is: The total percentage of opportunities created (or opportunities that reached a certain qualification stage) that ultimately end up in the "Won" status.
Why it matters: This is the ultimate measure of your overall sales effectiveness. It answers the fundamental question: "Of the potential deals we generate, what percentage are we successfully converting into revenue?"
Average Sales Cycle Length
What it is: The average amount of time it takes for an opportunity to move from its creation date (or from a specific early stage, like "Qualified") to being "Won."
Why it matters: A shorter sales cycle generally means greater operational efficiency and faster revenue recognition. If your sales cycle length starts to increase, it could indicate new friction in your process, a change in the market, or delays in follow-up that need to be addressed.
Average Deal Value (for Won Deals)
What it is: The average monetary value of all your successfully closed ("Won") deals within the selected period.
Why it matters: This metric is essential for revenue forecasting and for understanding which types of clients, products, or services are the most lucrative for your business.
Pipeline Value by Stage
What it is: The total potential revenue of all open deals currently sitting in each stage of your sales pipeline.
Why it matters: This provides a clear picture of your future potential income. When you combine this with the 'probability to close' percentage you've assigned to each stage, you can create a

highly insightful "weighted pipeline" value, which is a key component of sophisticated sales forecasting.
Number of New Opportunities Created
What it is: A simple but important metric tracking the volume of new potential deals entering your pipeline over a given period.
Why it matters: This tracks the inflow from your marketing and lead generation efforts. A decline in new opportunities is an early warning sign that your top-of-funnel needs attention.
Analysing Reasons for Lost Deals
What it is: When a deal is moved to the "Lost" status, smart sales processes involve populating a "Lost Reason" field on the opportunity card. This report analyses those reasons.
Why it matters: This is a goldmine of strategic insight. Are you consistently losing deals due to price, a specific competitor, missing features, or poor timing? Analysing these reasons provides crucial, direct feedback on your market positioning, pricing strategy, and product-service fit.
Stale Opportunities Report
What it is: This report identifies deals that have not had any recorded activity or have not moved stages within a predefined period (which you can often set in your pipeline settings).
Why it matters: These are the deals at the highest risk of going cold due to neglect. This report serves as a proactive action list for sales reps, prompting them to re-engage with these opportunities before they are lost completely.
Analysing Sales Team Performance (If Applicable - Agent Reporting in Lead Monsta)
For businesses with a sales team, the agent-specific reports are invaluable for management and coaching.
Opportunities Owned/Worked per Rep:
Tracks the volume of deals each team member is managing.
Individual Win Rates & Sales Cycle Lengths:
Compares the effectiveness and efficiency of each representative.
Activity Metrics per Rep:
Tracks the number of calls logged, appointments booked, emails sent, and tasks completed by each rep in relation to their opportunities.
Revenue Generated per Rep:
Shows the total value of deals closed by each individual.
Benefit: This data allows you to identify your top performers and analyse their strategies to share best practices with the rest of the team. It also helps you identify areas where specific individuals may need targeted coaching or support. For example, a rep with high activity but a low win rate might need coaching on their closing techniques.
Using Sales Reports to Make Strategic Decisions for Your Aussie Business
Data is only useful when it informs action. Here’s how to use your sales reports to make smarter decisions:
Optimising Your Sales Process:
If you notice a significant drop-off between your "Proposal Sent" and "Negotiation" stages, it might indicate that your proposals are not compelling enough or that your pricing is not being positioned correctly.
Refining Sales Training & Coaching:
Use individual rep metrics to tailor your coaching efforts. If a rep excels at booking initial meetings but struggles to close deals, focus their training on negotiation and closing skills.
Improving Lead Quality (Providing Feedback to Marketing):
If your sales team has a high level of activity but the overall win rate is low, and the primary "Lost Reason" is "Not a good fit," this is strong evidence that you need to work with your marketing team to refine lead generation targeting and qualification criteria.
Adjusting Sales Goals & Forecasts:
Use your historical conversion rates and sales cycle data to set more realistic and achievable sales targets for your team. This data-driven approach is far more effective than setting arbitrary goals.
Identifying Top Performing Products/Services:
If you use multiple pipelines for different service lines, your reports can clearly show you which offerings have the highest win rates or the most attractive average deal values, helping you to focus your sales and marketing efforts.
Integrating Sales Reports with Other Lead Monsta Data
The power of Lead Monsta lies in its all-in-one nature. Connect your sales report insights with other data for a complete picture:
Connect to Marketing Reports: Track leads from a specific Facebook ad campaign all the way through the sales pipeline to see the true conversion rate and ROI of that campaign.
Relate to CRM Data: Analyse your won deals to see if they share common tags or custom field attributes (e.g., "Do leads from the 'Construction' industry have a higher win rate?").
Best Practices for Sales Performance Reporting in Lead Monsta
Ensure Consistent and Accurate Data Entry: Your reports are only as good as the data going in. A culture of diligent and consistent opportunity card management is the absolute foundation of reliable reporting.
Define Your Key Performance Indicators (KPIs) Clearly: Decide which specific sales performance metrics SME goals are most important to your business and focus your regular analysis on those.
Schedule Regular Report Reviews: Make it a non-negotiable weekly or monthly habit for your sales leadership or the entire team to review these reports together.
Look for Trends, Not Just Snapshots: Analysing performance over several months or quarters will reveal more meaningful trends than looking at a single week in isolation.
Do Not Just Look at "Won" Deals: Analysing why you lose deals often provides more valuable and actionable learning opportunities than simply celebrating your wins.
Conclusion: From Data to Dominance in Your Sales Efforts
Lead Monsta's sales performance and pipeline reports provide Australian SMEs with the crucial, in-depth visibility required to understand and strategically optimise every single aspect of their sales engine. They allow you to move beyond simply tracking closed deals and start analysing the entire pipeline journey.
By embracing this data-driven approach, your business is empowered to make intelligent improvements, increase operational efficiency, coach your team effectively, and achieve more predictable and sustainable revenue growth. We encourage every business owner to set aside some time this Saturday afternoon, dive into their Lead Monsta sales reports, and identify one or two key areas for data-driven improvement. It’s a strategic investment that will pay handsome dividends.