What's Really Working? A Deep Dive into Lead Monsta's Marketing Campaign Reports for Aussie SMEs
Following our previous overview of Lead Monsta's comprehensive reporting dashboard, it's time to zoom in and focus on an area of critical importance for any ambitious Australian SME: understanding the precise performance of your specific marketing campaigns. You are likely investing valuable time and resources into sending targeted emails, crafting impactful SMS messages, managing your social media presence via the Planner, driving traffic to carefully constructed funnels and your website, and perhaps even allocating budget to Google or Facebook Ads. But amidst all this activity, how do you genuinely know what's truly delivering results and what might just be contributing to the noise?
This is where Lead Monsta's dedicated Lead Monsta marketing reports become your indispensable mission control. These reports are designed to provide clear, actionable insights into tracking engagement, monitoring conversions, and calculating the return on investment (ROI) across all these diverse marketing efforts.
The goal of this article is to guide Australian businesses, like yours, on how to effectively access, intelligently interpret, and strategically leverage the wealth of information found within Lead Monsta's Email, SMS, Website/Funnel, and integrated Ads reports. Armed with this knowledge, you can optimise your campaigns with precision and significantly maximise your marketing effectiveness for sustainable growth.
New Blog Post
Why Granular Campaign Reporting is Essential for Marketing Success: Beyond Surface-Level Metrics
Dissecting Email Marketing Performance in Lead Monsta: Intelligence in Your Inbox Metrics
Accessing Email Campaign Reports: Finding Your Statistics
Key Metrics & Their Strategic Interpretation for Aussie Audiences
Analysing SMS Campaign Effectiveness in Lead Monsta: Tracking Concise Impact
Accessing SMS Campaign Reports: Viewing Your Mobile Metrics
Understanding Website & Funnel Performance Analytics: Smart Insights from Your Digital Storefront
Accessing Site/Funnel Statistics in Lead Monsta
Key Metrics & Their Strategic Interpretation for Funnel Conversion Metrics
Leveraging Integrated Ad Campaign Reporting (Google & Facebook Ads)
Connecting Your Ad Accounts: A Brief Reminder
Key Ad Metrics Visible Within Lead Monsta
Benefits for Aussie SMEs: Unified Intelligence for Smarter Ad Spend
Attribution Reporting: Connecting Marketing Efforts to Results for Strategic Clarity
What is Attribution? Understanding the Customer Journey
Lead Monsta's Source & Conversion Reports: Gaining Insights into Paths
Importance for Optimising Overall Strategy: Focusing on What Truly Drives Value
Using Marketing Reports for Continuous Improvement: An Iterative Cycle of Intelligence
Conclusion: From Data to Decisions – Fuelling Smarter Marketing Growth
Why Granular Campaign Reporting is Essential for Marketing Success: Beyond Surface-Level Metrics
Relying on broad, top-level metrics like overall website traffic can be misleading. To truly understand marketing performance and make smart, corrective actions, you need to delve into granular campaign-specific data. This level of GHL campaign analytics Australia businesses can access is crucial for several reasons:
Moving Beyond Overall Metrics to Actionable Insights:
While knowing your total website visitors is interesting, it doesn't tell you which marketing activities are driving those visits, or, more importantly, which are leading to conversions. Granular reporting allows you to dissect performance campaign by campaign, channel by channel, providing a much deeper and more actionable understanding of what specific strategies are working.Identifying Your Top-Performing Assets Intelligently:
Which of your email subject lines consistently achieve the highest open rates? Which sales funnel boasts the best conversion rate from landing page to sale? Which specific ad platform or campaign variant is driving the most qualified leads? Granular reports help you pinpoint these top performers, enabling you to understand why they succeed and intelligently replicate those successful elements in future efforts.Optimising Underperforming Campaigns with Strategic Precision:
Conversely, detailed reports will also clearly highlight weaknesses in your marketing efforts. This might be a low click-through rate on a particular email campaign, a significant drop-off point in a specific funnel, or an ad campaign with a high cost-per-acquisition. Identifying these underperforming areas allows you to make targeted, strategic improvements rather than guessing where the problems lie.Allocating Budget and Resources Wisely for Maximum Impact:
Your marketing budget and team resources are precious. Granular campaign reports provide the data needed to make informed decisions about where to invest more and where to potentially scale back. By understanding which channels and campaigns demonstrably deliver the best ROI for your specific Australian audience, you can allocate your resources far more intelligently.Understanding Audience Engagement on a Deeper Level:
Different segments of your audience may interact differently with various campaigns. Campaign reports can provide insights into these varying engagement patterns, helping you refine your targeting and messaging for even greater relevance and impact.Improving Future Campaign Planning with Historical Intelligence:
The learnings gleaned from analysing past campaign reports are invaluable for planning stronger, more effective future marketing strategies. Understanding what has resonated (or not resonated) with your audience previously allows you to approach new campaigns with a foundation of data-driven intelligence, not just assumptions.
Dissecting Email Marketing Performance in Lead Monsta: Intelligence in Your Inbox Metrics
Email marketing remains a cornerstone for many SMEs. Understanding your email marketing performance SME data within Lead Monsta is key to optimising this channel.
Accessing Email Campaign Reports: Finding Your Statistics
Lead Monsta typically provides detailed statistics for individual email blasts (one-off campaigns) as well as for emails sent as part of automated sequences or workflows. You'll usually find these reports within the email marketing section or linked from specific campaign summaries.
Key Metrics & Their Strategic Interpretation for Aussie Audiences
It's not just about the numbers; it's about what they tell you for intelligent decision-making:
Delivery Rate: The percentage of emails that successfully reached the recipients' inboxes (i.e., did not hard bounce or soft bounce repeatedly).
Strategic Insight: A low delivery rate (high bounce rate) often indicates issues with your email list hygiene (e.g., old or invalid email addresses). Maintaining a clean list is crucial for deliverability and sender reputation.
Open Rate: The percentage of recipients who opened your email.
Strategic Insight: This is heavily influenced by your subject line's effectiveness, sender recognition (is your "from" name familiar and trusted?), and the overall relevance of the email to that specific list segment. While "good" open rates vary by industry and audience, consistently low open rates signal a need to revisit these elements.
Click-Through Rate (CTR): The percentage of recipients who opened the email and clicked on one or more links within it.
Strategic Insight: CTR is a strong indicator of your email copy's effectiveness, the appeal of your call-to-action (CTA), and the relevance of your offer to the audience who opened it. A high open rate but low CTR suggests your subject line worked, but the email content itself didn't compel action.
Conversion Rate (from email clicks): The percentage of those who clicked a link in your email and then completed a desired action on your website or landing page (e.g., made a purchase, filled out a form, booked a call via your Lead Monsta Calendar).
Strategic Insight: This is where the rubber meets the road. It requires goal tracking to be set up within Lead Monsta or your website analytics. A good CTR but low conversion rate might indicate issues with your landing page experience or a disconnect between the email's promise and the landing page's offer.
Unsubscribe Rate: The percentage of recipients who chose to opt out of future emails.
Strategic Insight: While some unsubscribes are normal, a consistently high rate can indicate that your messages are not relevant to the audience, are being sent too frequently, or that their expectations aren't being met.
Spam Complaint Rate: The percentage of recipients who marked your email as spam.
Strategic Insight: This is a critical metric. Even a low spam complaint rate can severely damage your sender reputation and future email deliverability. It’s essential to monitor this and ensure your list is permission-based and your content is valuable.
Using Email Reports for Intelligent Optimisation
Analysing these metrics empowers you to:
A/B test subject lines: See which variations lead to higher open rates.
Identify best-performing content and offers: Understand what resonates most with your audience.
Refine audience segmentation: Tailor messages more precisely based on differing engagement patterns.
Optimise send times and days: Experiment to find when your audience is most receptive.
Analysing SMS Campaign Effectiveness in Lead Monsta: Tracking Concise Impact
For short, sharp, and immediate communication, SMS marketing can be highly effective. Lead Monsta provides tools for SMS campaign tracking.
Accessing SMS Campaign Reports: Viewing Your Mobile Metrics
Similar to email reports, you should be able to find statistics for bulk SMS sends and for SMS messages deployed within your automated workflows.
Key Metrics & Their Strategic Interpretation
Given the nature of SMS, the key metrics are slightly different:
Delivery Rate: The percentage of SMS messages successfully delivered to valid mobile numbers.
Strategic Insight: High failure rates indicate issues with your contact data (incorrect or deactivated numbers).
Click-Through Rate (CTR) (on links): If your SMS includes a link (e.g., to a landing page or special offer), this measures how many recipients clicked it.
Strategic Insight: Reflects the effectiveness of your SMS call to action, the clarity of your message, and the appeal of the offer within the concise format of an SMS.
Response Rate (for conversational SMS): If your SMS is designed to elicit a direct reply (e.g., "Reply YES to confirm your appointment").
Strategic Insight: Measures direct engagement and the clarity of your request.
Opt-Out Rate (e.g., via "STOP" replies): The percentage of recipients who chose to unsubscribe from future SMS messages.
Strategic Insight: Essential for compliance and indicates message relevance. A high opt-out rate suggests your SMS messages may be perceived as intrusive or irrelevant.
Conversion Rate (from SMS links): The percentage of link clickers who completed a desired action.
Strategic Insight: Tracks the ultimate effectiveness of your SMS campaign in driving specific outcomes.
Using SMS Reports for Intelligent Refinement
SMS reports help you:
Refine SMS copy: Ensure your messages are concise, clear, and have a compelling call to action within the character limits.
Test different offers: See which promotions or calls to action generate the best response via SMS.
Optimise timing: SMS is often seen immediately, so timing can be critical. Test different send times for optimal impact.
Understanding Website & Funnel Performance Analytics: Smart Insights from Your Digital Storefront
Your website and sales/lead generation funnels are critical digital assets. Lead Monsta's website traffic analysis GHL capabilities provide insights into their performance.
Accessing Site/Funnel Statistics in Lead Monsta
These statistics are usually found within the "Sites" section of Lead Monsta, where you build and manage your websites and funnels. You can often view analytics for an entire website or for individual funnels and their specific steps. Some platforms also offer dedicated "Traffic" or "Attribution" reports.
Key Metrics & Their Strategic Interpretation for Funnel Conversion Metrics
Understanding these metrics is vital for diagnosing your customer journey and optimising your funnel conversion metrics:
Page Views (Total & Unique): The overall number of times specific pages or funnel steps are viewed, and the number of individual visitors.
Strategic Insight: Indicates the volume of traffic reaching different parts of your site or funnel. Low views on critical pages may indicate a problem further up the chain.
Traffic Sources: Where are your website and funnel visitors coming from? (e.g., Organic Search, Social Media, Email Campaigns, Referral Links, Paid Ads).
Strategic Insight: Helps you understand which marketing channels are most effective at driving traffic to your key conversion assets. This allows for smarter allocation of resources to high-performing channels.
Conversion Rate per Funnel Step: This is crucial. It shows the percentage of visitors who successfully move from one step of your funnel to the next.
Strategic Insight: Allows you to pinpoint exactly where visitors are dropping off in your sales or lead generation process (e.g., high views on a landing page but low opt-ins, or many opt-ins but few sales page visits). This is essential for identifying bottlenecks and areas needing urgent optimisation.
Opt-in Rates (for Lead Capture Funnels): The percentage of visitors to a landing page who

successfully submit their details via an opt-in form.
Strategic Insight: Directly measures the effectiveness of your lead capture mechanisms – your headline, copy, offer, and form design.
Sales/Revenue Generated (for Sales Funnels): Direct tracking of revenue generated from sales made through a specific funnel.
Strategic Insight: Provides a clear ROI calculation for your sales funnel efforts.
Earnings Per View/Click (for Sales Funnels): Metrics that can help you understand the value of each visitor or click within a sales funnel context.
Strategic Insight: Useful for optimising ad spend and understanding the profitability of different traffic sources.
Using Site/Funnel Reports for Strategic Optimisation
These reports empower you to:
Optimise landing page copy and design: Improve clarity, value proposition, and user experience to increase conversions.
Strengthen Calls to Action (CTAs): Make them more compelling and prominent.
A/B test different funnel steps: Experiment with variations in headlines, offers, page layouts, or form fields to see what performs best.
Identify and focus on your best traffic sources: Double down on channels that deliver converting visitors.
Leveraging Integrated Ad Campaign Reporting (Google & Facebook Ads)
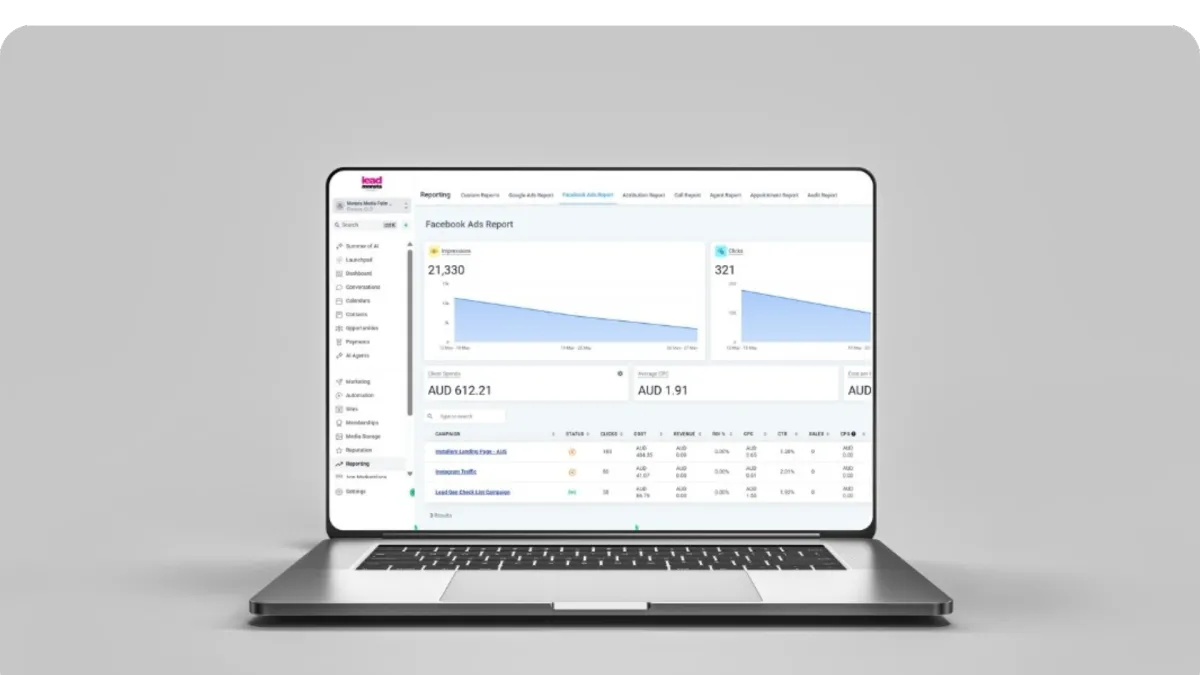
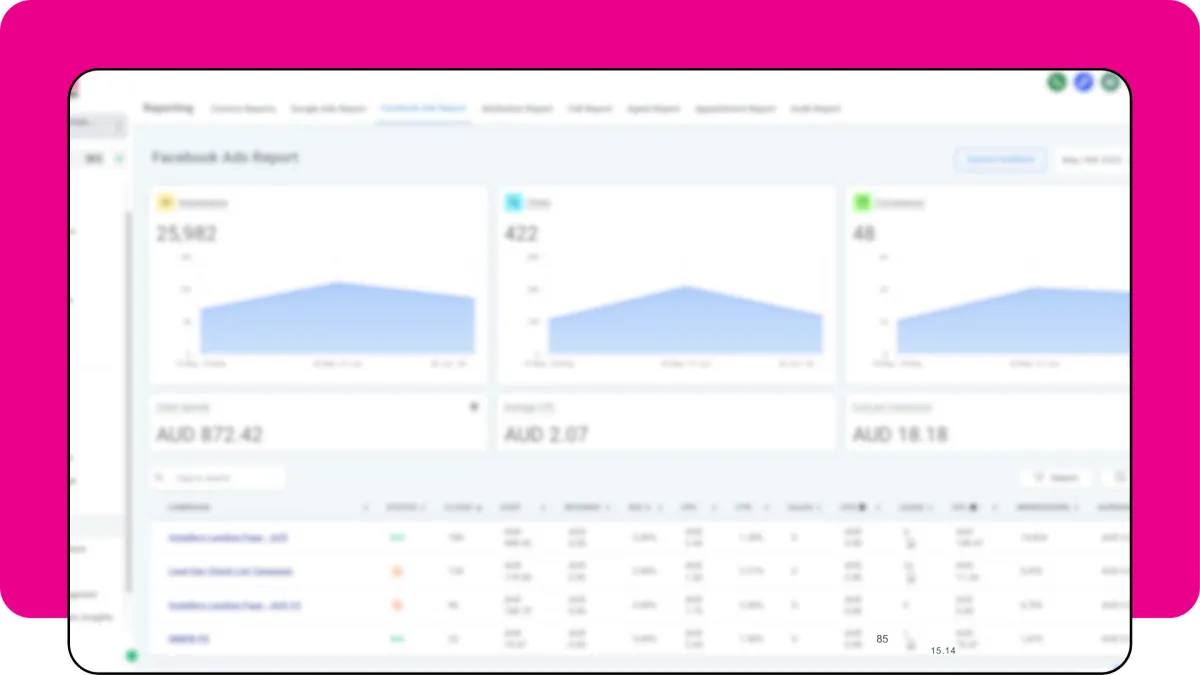
For many Aussie SMEs, paid advertising on platforms like Google and Facebook is a key part of their marketing mix. Lead Monsta often allows for integration with these ad accounts, bringing performance data into a unified dashboard. This provides powerful Facebook Ads reporting Lead Monsta and Google Ads insights GHL users need.
Connecting Your Ad Accounts: A Brief Reminder
The setup process usually involves authorising Lead Monsta to access data from your Google Ads and Facebook Ads Manager accounts. This is typically done within the "Integrations" section of Lead Monsta settings.
Key Ad Metrics Visible Within Lead Monsta
Once connected, you can often see crucial ad performance metrics directly within Lead Monsta, such as:
Impressions & Reach: How many times your ads were shown and to how many unique people.
Clicks & Click-Through Rate (CTR): How many people clicked your ads and the percentage of impressions that resulted in a click.
Cost Per Click (CPC): The average amount you paid for each click.
Ad Spend: The total amount spent on your campaigns.
Conversions (Leads/Purchases attributed to ads): The number of desired actions (e.g., leads generated, sales made) that were attributed to your ad campaigns.
Cost Per Conversion/Acquisition (CPA): How much it cost you, on average, to acquire a lead or customer through your ads.
Return on Ad Spend (ROAS): If revenue tracking is properly configured, this shows the revenue generated for every dollar spent on advertising.
Benefits for Aussie SMEs: Unified Intelligence for Smarter Ad Spend
The primary benefit here is having a holistic view. Instead of constantly logging into separate Google Ads and Facebook Ads platforms, you can see your key ad performance metrics alongside your organic marketing results within Lead Monsta. This allows for:
Quicker assessment of ROI: Are your paid campaigns delivering a positive return?
More informed budget decisions: Seeing the full picture helps you allocate your advertising budget more intelligently. Imagine reviewing your week's ad spend and performance for your Elanora-based business on a Saturday morning; this unified view allows for timely adjustments to optimise campaigns for the week ahead.
Attribution Reporting: Connecting Marketing Efforts to Results for Strategic Clarity
Understanding how different marketing touchpoints contribute to a final conversion is key to a truly intelligent marketing strategy.
What is Attribution? Understanding the Customer Journey
Marketing attribution is the science of identifying and assigning value to the various marketing touchpoints a customer interacts with on their path to conversion (becoming a lead or making a purchase). Few conversions happen after just one touchpoint; attribution helps you understand the whole journey.
Lead Monsta's Source & Conversion Reports: Gaining Insights into Paths
Lead Monsta typically includes reports that attempt to attribute conversions back to their original sources (e.g., Google Organic search, a specific Facebook Ad, an email campaign, a referral link). While perfect multi-touch attribution can be complex, these reports provide valuable insights into which channels are initiating or influencing conversions.
Importance for Optimising Overall Strategy: Focusing on What Truly Drives Value
By understanding which channels and campaigns are most frequently involved in generating leads and sales, you can more accurately assess the true value of each component of your marketing mix. This allows you to optimise your overall strategy with greater confidence, investing in the touchpoints that demonstrably contribute to your business goals.
Using Marketing Reports for Continuous Improvement: An Iterative Cycle of Intelligence
The data in your Lead Monsta marketing reports is not just for historical record-keeping; it's a powerful tool for ongoing, intelligent refinement:
Set Benchmarks: Understand your current performance baselines for key metrics. This allows you to measure the impact of any changes you make.
Identify Trends: Look for patterns in your data over time (weekly, monthly, quarterly). Are open rates improving? Is funnel conversion trending up or down?
Compare Campaigns: Analyse the performance of different types of offers, messaging styles, or channels to see what resonates best with your specific Australian audience.
Make Informed Adjustments – The Core of Smart Marketing: Don't just collect data; use it. Let the insights guide your decisions to refine targeting, improve ad copy, optimise landing page designs, reallocate budget, and test new approaches. This iterative cycle of analysis, action, and re-evaluation is the hallmark of a smart, data-driven marketer.
Conclusion: From Data to Decisions – Fuelling Smarter Marketing Growth
Lead Monsta's suite of marketing reports provides Australian SMEs with critical visibility into the performance of their campaigns across a multitude of channels. This data is the raw material for intelligent decision-making.
By committing to regularly accessing, analysing, and acting upon these insights, businesses can move beyond assumptions and guesswork. You can truly understand what resonates with your audience, strategically optimise your marketing efforts for a better return on investment, and make smarter, data-driven decisions that consistently fuel business growth. This disciplined approach transforms your marketing from a cost centre into a predictable engine for success.